Interpreting Sleep Study Reports:
A Primer for Pulmonary Fellows
By Martha E. Billings, MD MSc
for the Sleep Education for Pulmonary
Fellows and Practitioners, SRN ATS Committee
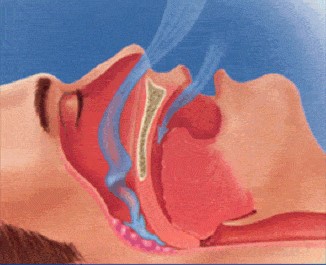
Obstructive Sleep Apnea
- Obstructive sleep apnea: repeated closure or narrowing of upper airway reducing airflow
- Apnea: total cessation of air flow for 10 sec
- Hypopnea: 10 sec of reduced air flow
- Obstructive respiratory events are associated with snoring, thoracoabdomnial paradox & increasing effort
Polysomnogram (PSG)
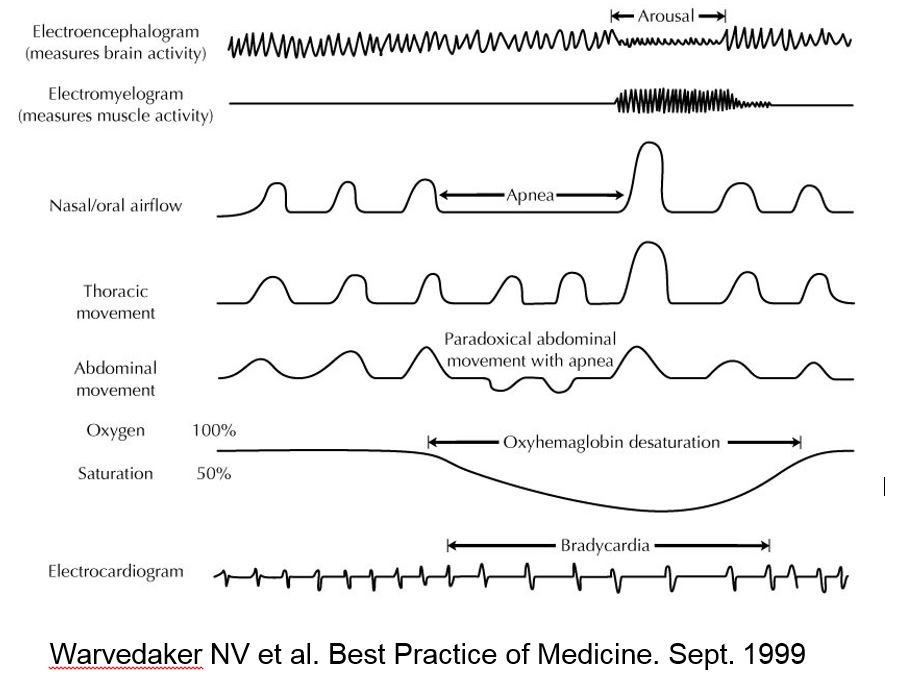
Scoring Criteria: Respiratory Events
- Hypopnea definition
- ↓ flow ≥ 30% from baseline for at least 10 seconds
- 1A. (AASM) with 3% O2 desaturation OR arousal
- Requires EEG monitoring
- 1B. (CMS) with 4% O2 desaturation
- Amenable to portable studies
- Respiratory Effort Related Arousal (RERA)
- Flattening of inspiratory portion of nasal pressure (or PAP flow) with increasing respiratory effort leading to arousal
- No associated desaturation
- Requires EEG monitoring
AASM Scoring Manual Version 2.1, 2014
Apnea Hypopnea Index
AHI = (# apneas + # hypopneas) / sleep hours
- AHI < 5 normal
- AHI 5 – 15 mild
- AHI 15 – 30 moderate
- AHI > 30 severe
RDI = (# apneas + # hypopneas + # RERAs) / sleep hours
- Can be large difference in AHI vs. RDI if young, thin patient who is less likely to desaturate by 4% with events
- Treatment not covered by Medicare if AHI < 5 but some insurances accept RDI >5 (with AHI < 5) with symptoms
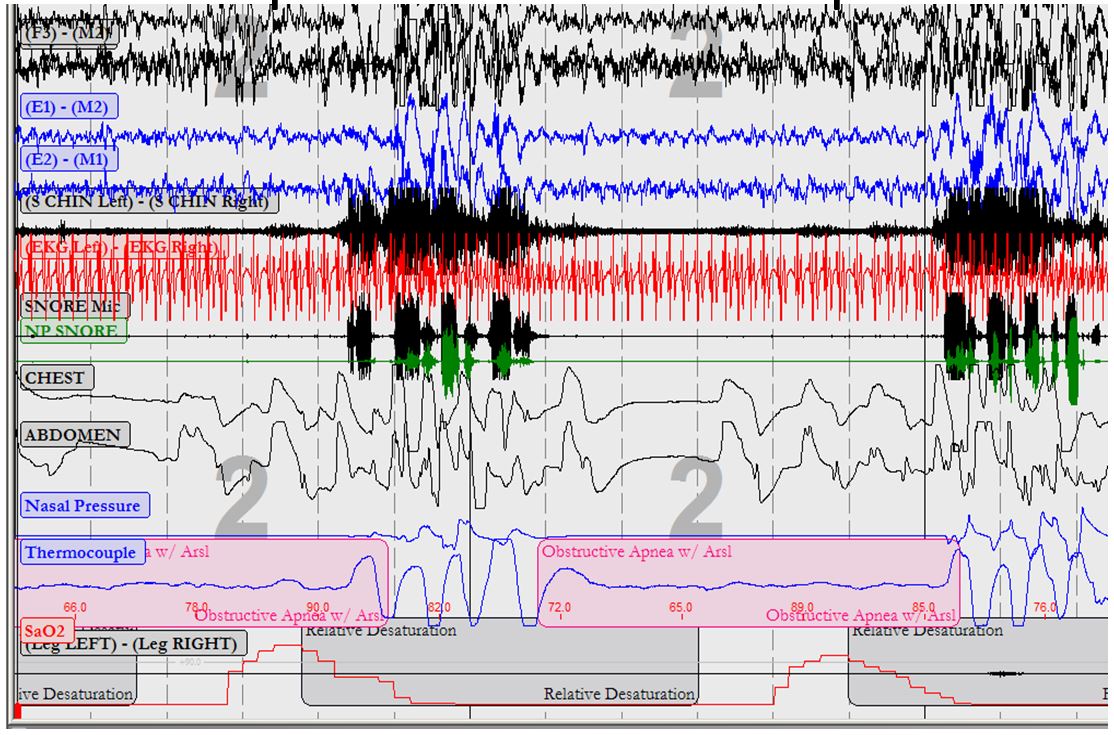
PSG Epoch: Obstructive Apneas
In-lab PSG Data
Respiratory Data:
-
# Central, obstructive apneas, hypopneas & RERAs
- AHI & RDI by position and sleep stage
- Central apnea index & if Cheyne-Stokes pattern
- Oximetry:
- Oxygen Desaturation Index
- Mean O2 saturation & nadir
- Hypoxemic burden
- Cumulative % of sleep time spent under 90%
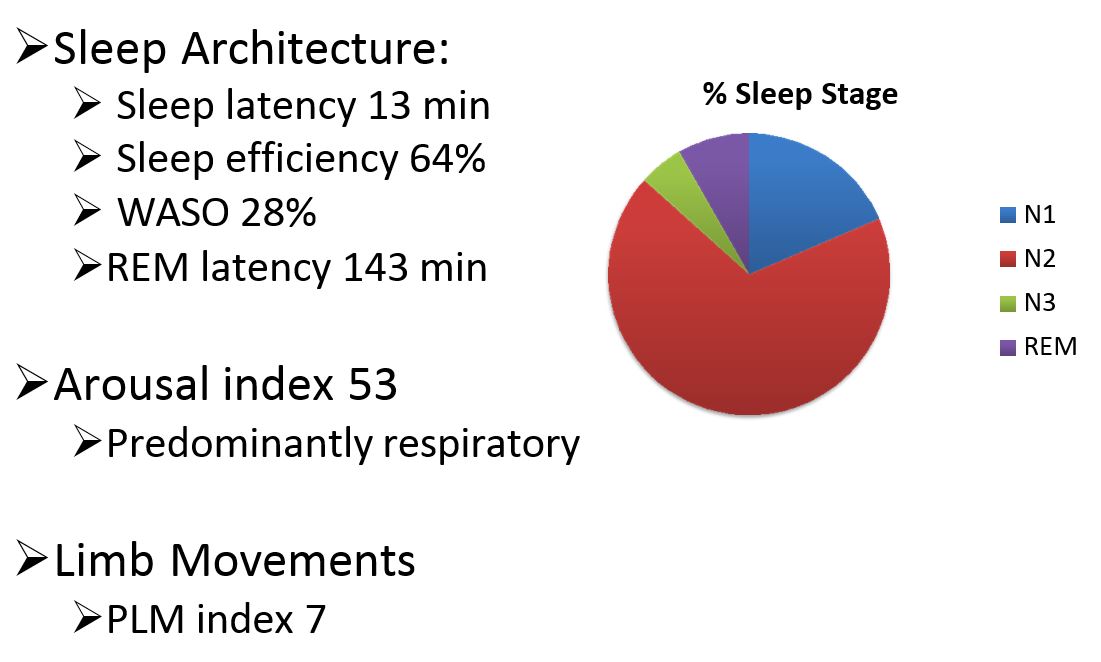
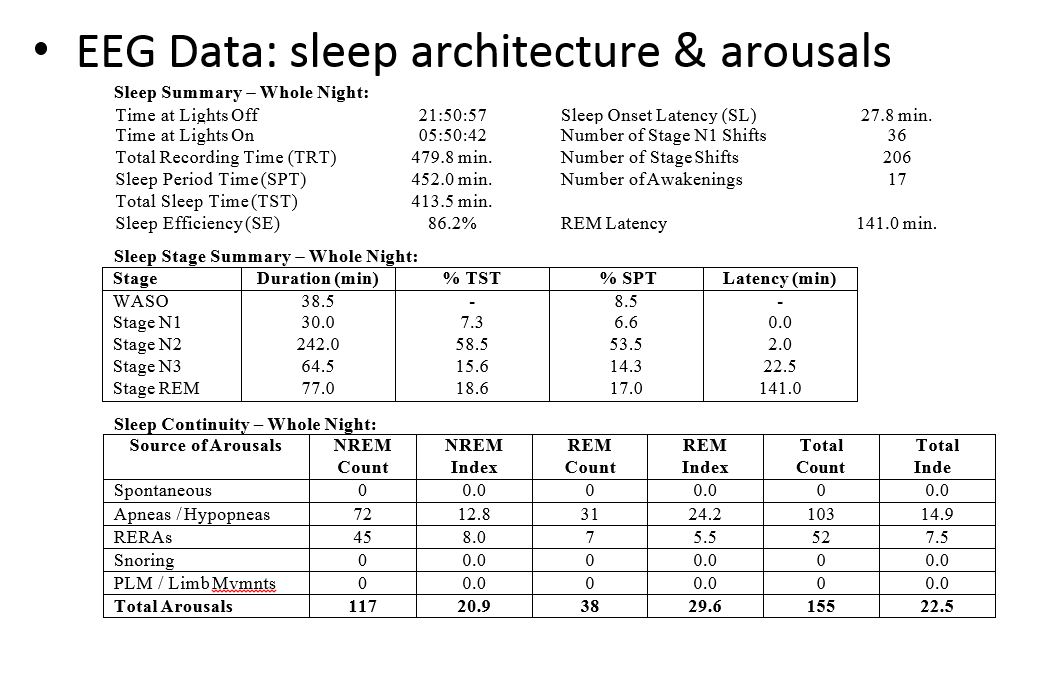
EEGData:
Sleep efficiency & latency
- Normal 80% efficient
- Latency < 30 min, REM latency 60-120 min
Sleep stages & architecture
- Normal about 5% stage N1, 50% N2, 20% N3 (slow wave sleep) and 20-25% REM
Arousal Index (AI): sleep disruption
- Normal AI < 10-25 (large variation by age)
Norms are all age dependent
- in general less REM & SWS, more arousals, WASO and lower sleep efficiency as age
EEG abnormalities
- Epileptiform activity, alpha intrusion
Sleep Architecture Over Lifespan
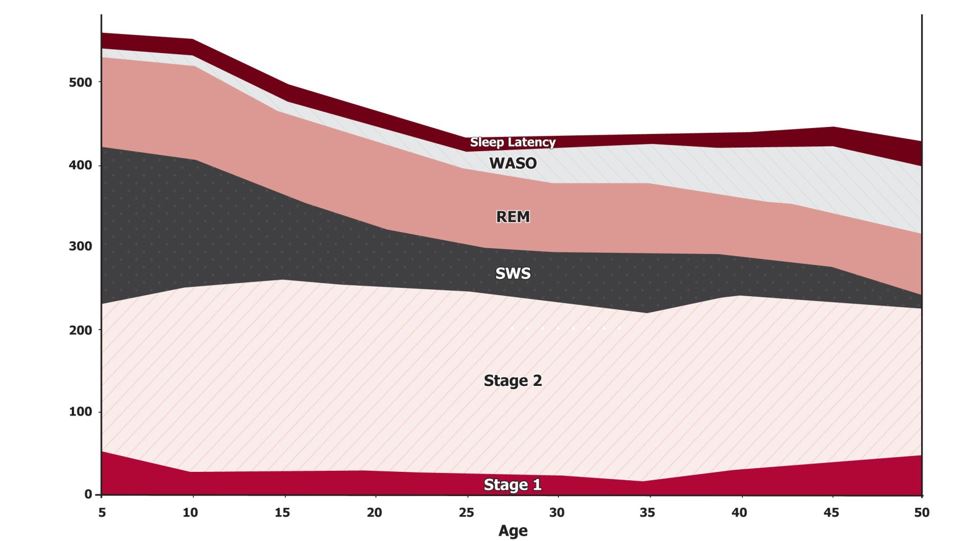
Ohayon MM, Carskadon MA, Guilleminault C, Vitiello MV. Meta-analysis of quantitative sleep parameters from childhood to old age in healthy individuals: developing normative sleep values across the human lifespan. Sleep 2004;27(7):1255-73
EMG Data & Video
Limb Movements
- periodic limb movements index in wake & sleep
- Normal PLMI < 15 adults
- Movements during REM (loss of atonia)
Parasomnias
- Sleep walking, talking
- Bruxism
- REM sleep behavior disorder
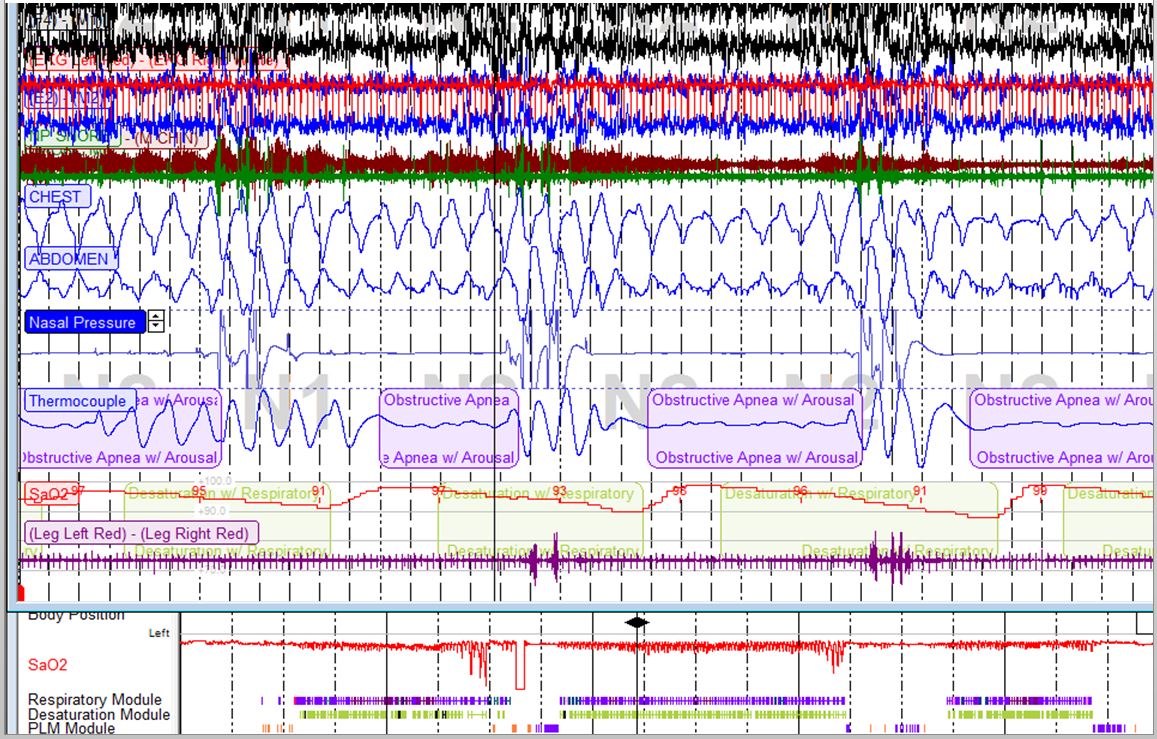
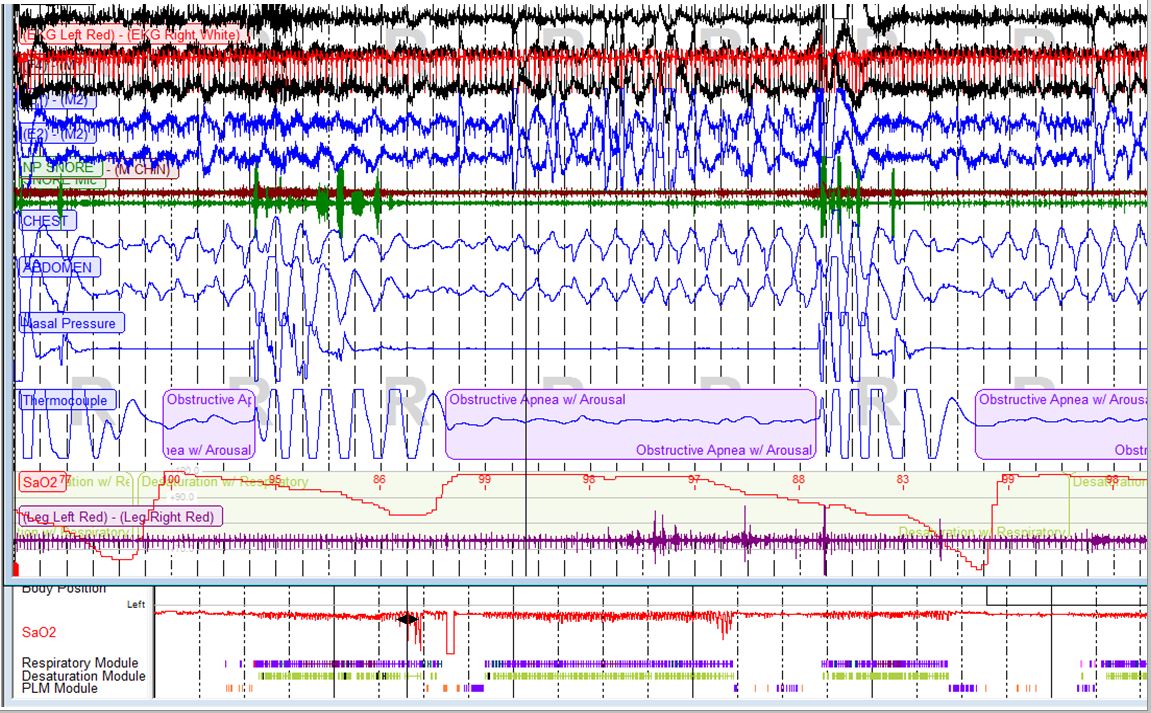
Classic OSA (300 sec)
Sample PSG Results
Sleep Study Sample Report
Sample PSG Results: OSA
Respiratory Data:
- Apnea Hypopnea Index: AHI 17
- 12 obstructive apneas, 45 hypopneas
- RERA index 34
- Oxygenation Desaturation Index: ODI 13
- Nadir O2Saturation: 86%
- Hypoxemic Burden: 13% of study O2 sat < 90%
- Most severe supine, REM sleep (AHI 53)
- Total RDI: 55
Sample PSG Report
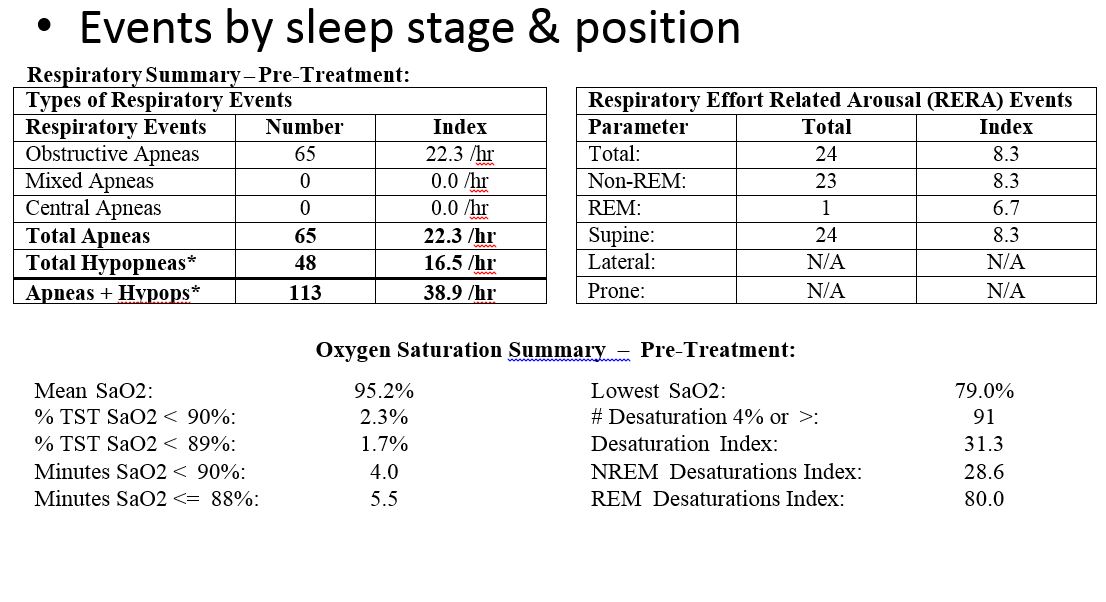
Respiratory Events by Position
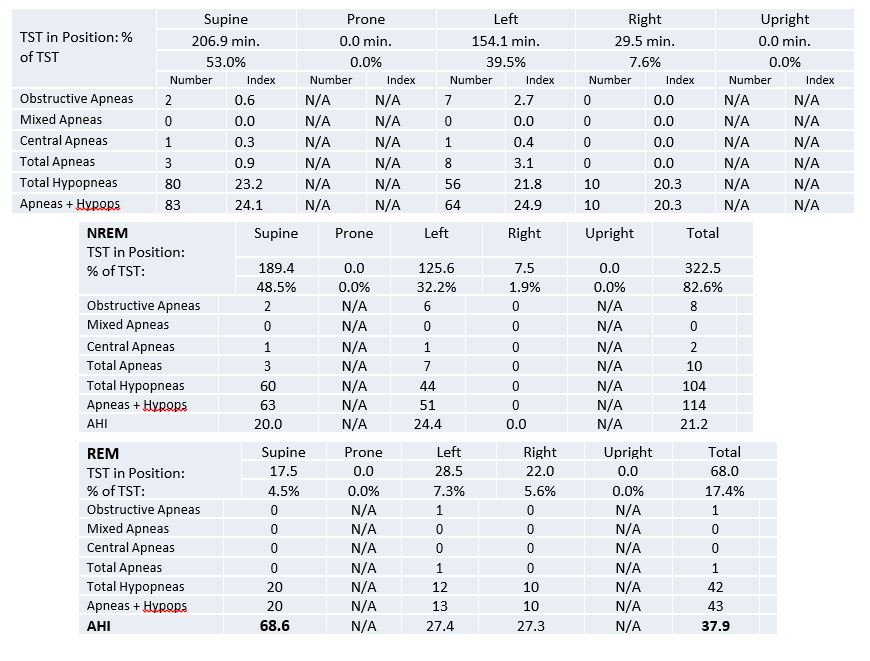
Sample Hypnogram
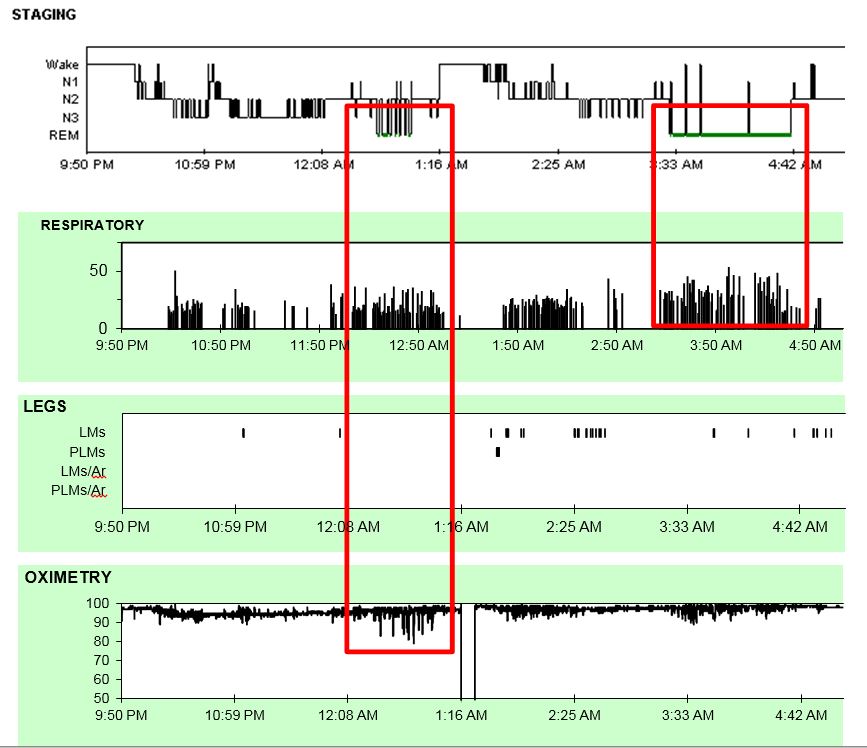
Dramatic OSA in REM
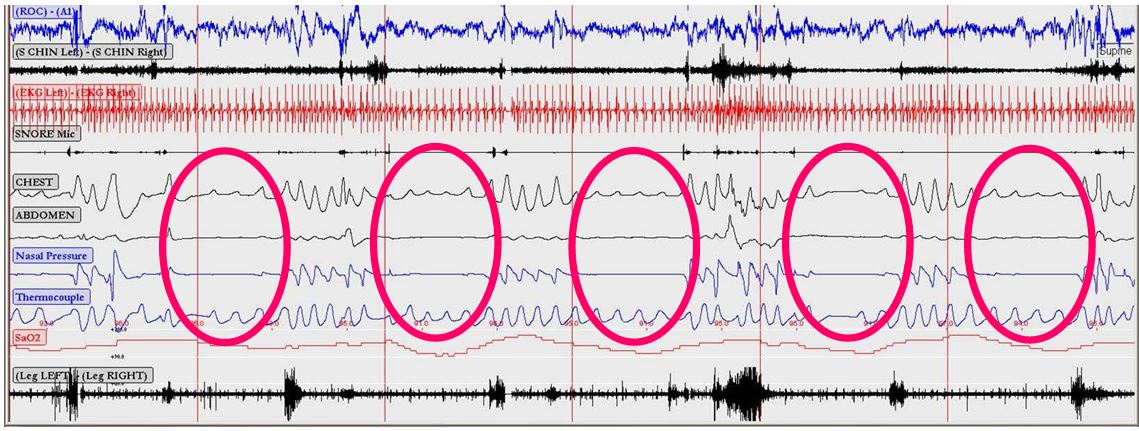
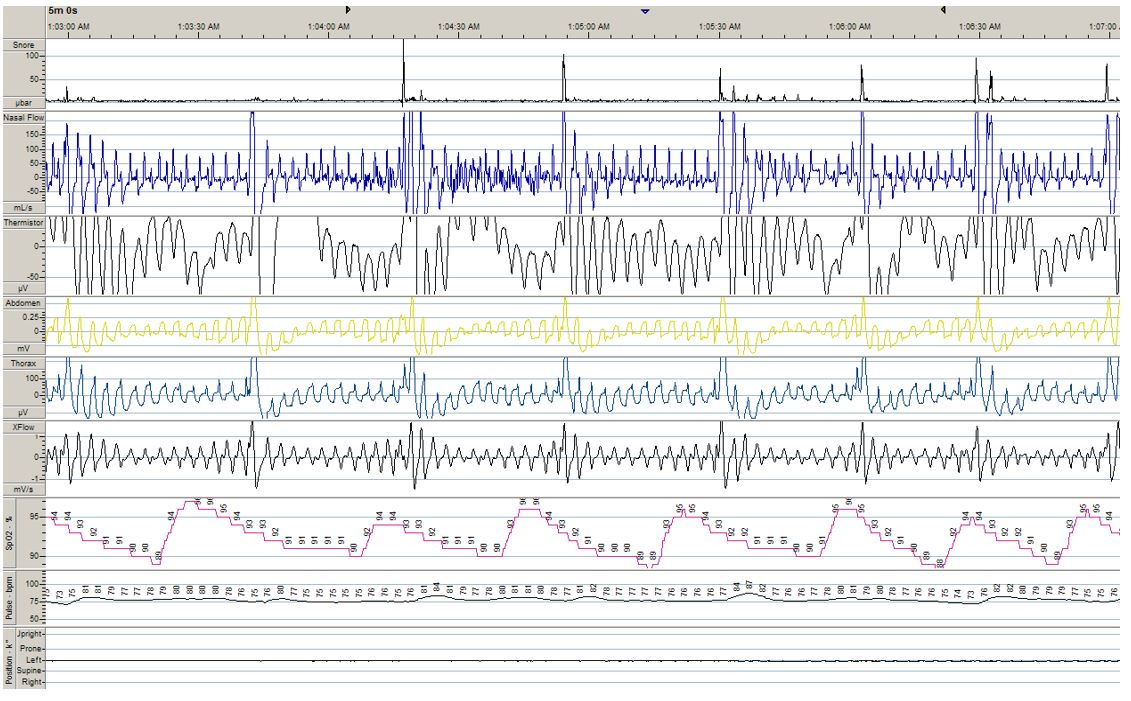
PSG: 120 sec Epoch
- Obstructive hypopneas/ RERAs with clear arousals but not consistent desaturation
Home Sleep Study (OCST)
- Respiratory data only (estimated AHI, ODI) calculated from recording time
- Underestimates AHI as recording time > time asleep
- Problematic if insomnia
- No EEG to determine sleep or arousal
- No arousal associated hypopneas scored
- No respiratory effort related arousals (RERAs)
- No information by sleep stage (REM/NREM or if asleep)
- Higher rates of technical failure
- Appropriate for high likelihood OSA & no other sleep disorders or respiratory/cardiac disease
Home Study Tracing
Sample OCST Results
- Total recording time: 423 minutes
- Supine sleep: 34%
- AHI 8.4
- 3 obstructive apneas, 2 central apneas
- Oximetry
- ODI 7
- Nadir saturation 87%, mean 94%
- Same patient as in sample PSG but lower AHI estimated b/c of poor sleep efficiency & less REM
Summary
- In lab PSG provides details regarding EEG, EMG to give more complete evaluation of sleep disorder
- When interpreting sleep study results, remember to consider:
- % supine, REM sleep captured
- AHI often underestimated in OCST
- RDI vs. AHI & hypopnea criteria used
Download case in PowerPoint or PDF.
Please complete the online survey and download your certificate.